The most powerful loyalty insights for your brand
Built from over 12 years of LoyaltyLion data, covering 250M+ shoppers and 10k+ programs. These benchmarks show the real cumulative revenue generated by loyalty activity.
Real loyalty program performance
No projections here. We’re giving you the live performance data from thousands of active LoyaltyLion programs.
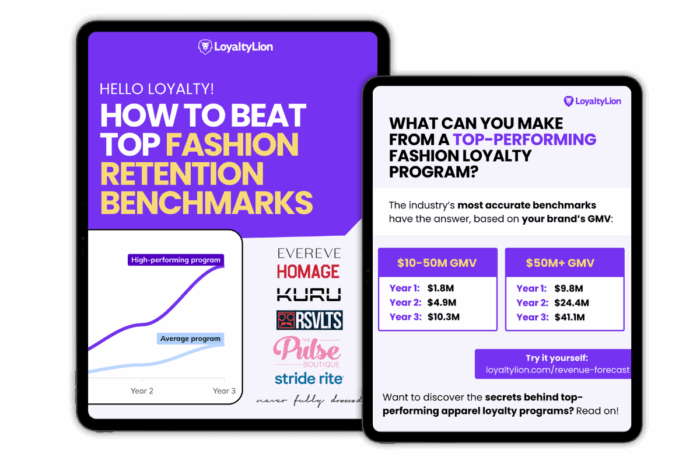
Cumulative loyalty-attributed revenue
Includes revenue driven by referrals, loyalty components, email & SMS, and repeat purchases from redeeming members so that you can see the full impact over time.
Industry-specific
Benchmarks are segmented by industry and revenue range so you can drill into the data relevant to you.
Statistically valid
12+ years of data across 250M+ shoppers and 10k+ programs. Results are representative of all programs, not just the top performers.