Owning a Shopify store comes with having to track tons of data to find nuggets of insight to improve the store’s performance. One of those nuggets, or metrics, is Average Order Value (AOV). The AOV metric refers to how much your customers spend per transaction.
AOV for ecommerce brands is important because it helps you monitor your profitability per customer. And knowing where you stand is the first step to improving performance.
In this guide, we’ll show you:
- How to calculate the AOV for your Shopify store
- What a “good” AOV is for Shopify stores
- The downsides of AOV as a metric
- How to improve your AOV in Shopify
- How a loyalty program can improve your Shopify AOV
How to calculate the average order value for your Shopify store
Calculating your store’s AOV is simple, you just need to input your store’s numbers into this formula:
AOV = Total Revenue / Total Number of Orders
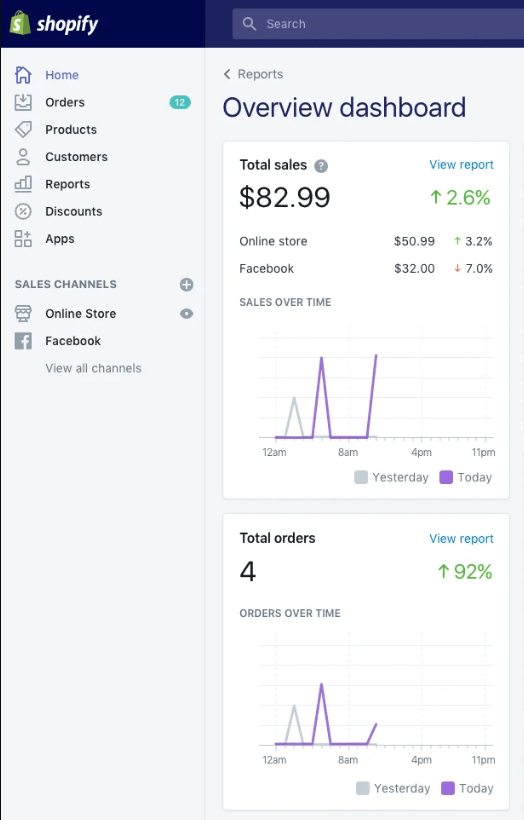
In Shopify, you have access to “Total Orders” as a default metric in your dashboard.

You can also see above in the screenshot the other part of the formula you would likely think that you need, “Total Sales.”
But let’s see what happens when we use those figures in the screenshot as an example, the average order value of the day would be:
$82.99 / 4 = $20.74 AOV
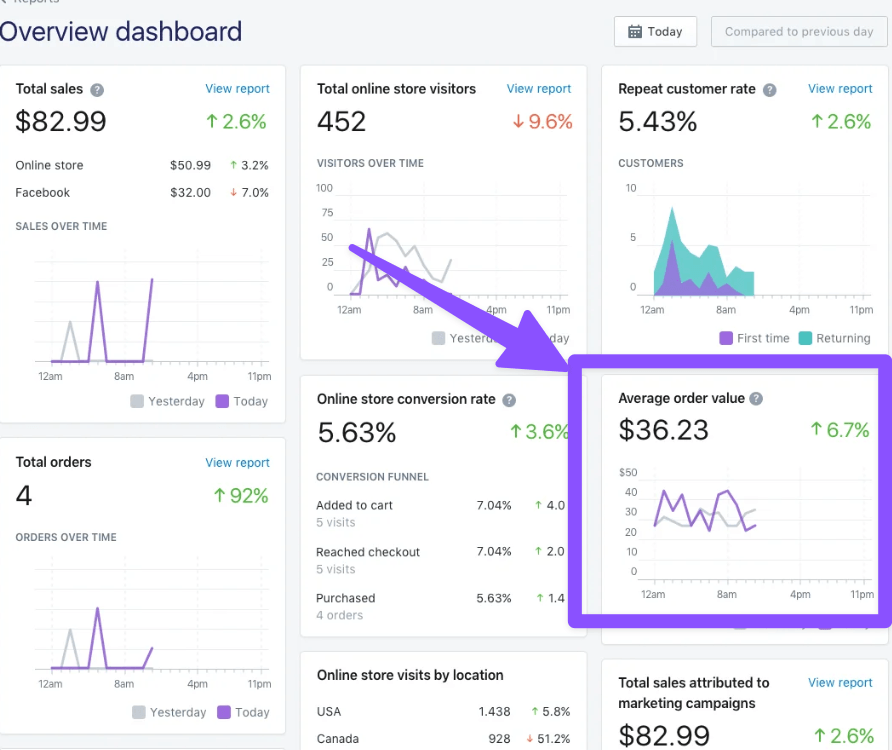
Why then, in the same dashboard, do we find this figure?

In this case, Shopify is telling us the AOV is $36.23. What’s the difference?
According to their help docs, Shopify’s AOV uses the following calculation:
“(AOV) Equates to gross sales (excluding adjustments) – discounts (excluding adjustments) / number of orders. Adjustments include all edits, exchanges, or returns that are made to an order after it’s initially created.”
This means the AOV figure is based on revenue. The “Total Sales” figure includes these post-order adjustments, making it closer to a profit figure rather than revenue.
If you wanted to calculate the figures manually, you would need to go into your analytic reports and look for the “Gross Sales” figure to match the revenue-based AOV formula.
However, as you can see in the example screenshot, Shopify includes your store’s AOV on your default dashboard.
By default, your dashboard displays daily metrics. If you want to look at longer time periods you’ll need to use the Average Order Value Over Time report. From there, you can change the time unit by clicking on the Group by option in the report.
What is a “good” average order value in Shopify?
Figuring out a “good” AOV benchmark for your store is challenging because there are many factors to consider. Where is your target audience located? What type of goods do you sell? Do you sell small, frequently bought items or large, less frequently bought items?
The answers to these questions significantly impact what a “good” AOV would be for your store.
Even so, we can find some averages that may be helpful to start with. Using data from Dynamic Yield, as of October 2024, benchmark AOVs looked like this:
- Global annual AOV is $133
- In October 2024, AOV in the Americas was $204, followed by $160 in the APAC region, and $112 in the EMEA region.
- By industry (globally), in October 2024 AOVs were:
- Luxury and Jewelry: $265
- Beauty and Personal Care: $71
- Pet Care and Veterinary Services: $83
- Food and Beverage: $113
- Multi-brand Retail: $91
- Fashion, Accessories, and Apparel: $194
- Consumer Goods: $199
- Home and Furniture: $247
If you’re looking at these benchmarks and thinking “Wow, those are way higher than my AOV,” don’t worry. There isn’t a single “good” AOV figure for Shopify stores considering how different purchase sizes and frequencies can be across different stores.
The downsides of average order value
Average Order Value is a great metric, especially when you track it over time. However, it’s only one piece of a bigger puzzle, and it can get skewed by extremely high or low orders.
If you only focus on your AOV, you might miss other crucial performance metrics and leave money on the table. So, what are some other metrics worth considering that you can calculate within your Shopify store?
Repeat Purchase Rate
If a customer makes a single large purchase, that transaction would spike your AOV. But what if they never come back? Customer retention is a crucial factor of success for Shopify stores — it keeps your business sustainable for the long term.
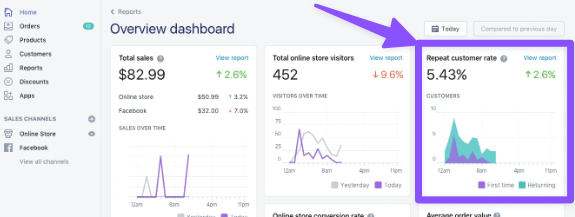
Repeat Purchase Rate (RPR) is a metric you can use to see the percentage of customers that return to buy from your store.
The formula for this metric is:
RPR = (Number of Customers Who Have Made Repeat Purchases / Total Number of Customers) x 100
In Shopify, this metric is called the “Returning Customer Rate,” or “Repeat Customer Rate,” the calculation is the same. You can see this metric in the sample dashboard below:

Customer Lifetime Value (CLV)
Customer Lifetime Value is a tricky metric to measure, so it’s not always the best choice if you’re looking for concrete accuracy.
It’s worth considering because it provides a bigger picture of customer loyalty and helps you segment customers more appropriately.
The formula for calculating CLV is:
(Average Order Value x Purchase Frequency) x Average Customer Lifespan
This formula is tricky for Shopify store owners because a) Shopify doesn’t have an easy metric tile for it, and b) “average customer lifespan” is difficult to figure out for Shopify stores.
We have a full guide breaking down ecommerce CLV here:
Read more: Ecommerce CLV: How to Calculate and Improve It
Customer Retention Rate
It’s easy to confuse Customer Retention Rate (CRR) with Repeat Purchase Rate, but there is a subtle difference. CRR measures the proportion of your loyal customers based on the number of customers who made a purchase in a time period, the number of new customers, and the number of repeat customers.
The formula for this calculation is:
CRR = (Total Number of Customers – Number of New Customers / Starting Customers) x 100
This one is easier to understand with an example:
A store had 300 customers at the start of the last quarter, it ended the quarter with 310 customers but added 40 new customers in that period. So:
(310 – 40 / 300) x 100 = 90 percent CRR
In Shopify, you can use a similar report to get the idea of CRR using Customer cohort analysis. Shopify will group customers based on the date of their first purchase, and you can get the retention rate of first-time customers over time.
Alternatively, you can use the Customers over Time report to find the number of new and returning customers in a period. Then use the end of the previous period to determine the Starting Customers figure of the period you want to measure.
How to improve your average order value (AOV) in Shopify
There are a few tactics you can use to help improve the AOV of your Shopify store. Let’s look at a few of them below.
- Offering free shipping over a certain purchase value is a common tactic, and so customers come to expect it. For example, Edgard & Cooper has free delivery thresholds based on the country of the order.
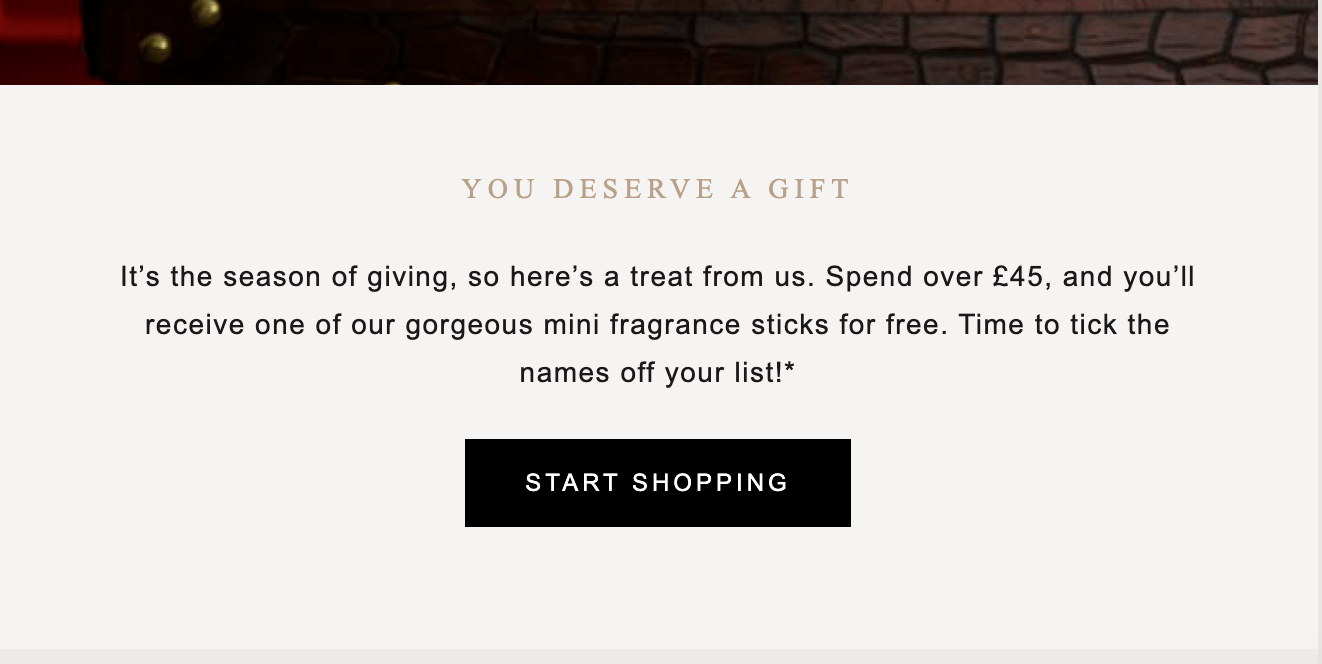
- Offering free gifts with a minimum spend. You don’t have to offer free gifts continuously, but you can create promotional periods (like Christmas) when free gifts are included. Here’s an example from Rituals Cosmetics in my email inbox:

- Create product bundles. If you sell lots of products and some could become a theme (or belong to a product line), create bundled pricing to increase average order value. This tactic is common for beauty or health and wellness stores.
- Implementing a loyalty program. You can create a loyalty program to reward customers who spend more in your store. We’ll get into more detail on this tactic in the next section below.
Each of these tactics can help improve your overall AOV, but implementing a loyalty program is the best, long-term option.
How a loyalty program can improve your Shopify AOV
Loyalty programs are a strong vehicle for helping you drive up your AOV performance. Here’s how (and why).
Loyalty programs give you a ton of customer data
The first major factor for how and why loyalty programs improve AOV is data.
Loyalty programs, like the ones you can create with LoyaltyLion, give you a huge amount of zero-party data, such as rewards redemption rates, average purchase frequency, time to second purchase, customer lifetime value, and more.
For improving AOV, your loyalty program data can tell you which customers are loyal, which are “at risk,” and which have churned and are an opportunity to “win back.”
You can use the data from these segments to send targeted email sequences with email or SMS integrations like Klaviyo and Attentive, encouraging customers to return and spend more.
An example of a brand that used this data-driven approach with LoyaltyLion is The Organic Butchery (previously called Coombe Farm Organic).
Even with a relatively simple points-based program, the team used loyalty data and created loyalty-specific email sequences, which saw a 30% click rate. That is compared to an ecommerce industry average of 1.74% click rate.
These improvements led to a 70% increase in loyalty-related spending, which significantly improved AOV.
They help gamify loyal behavior
Brands can also choose to implement a tiered loyalty program. In this case, customers receive increasingly better or more exclusive rewards for the more loyal behavior they demonstrate.
For example, spending over a specific amount on products gets a customer into the next tier of rewards. This new tier includes access to giveaways or more points per $ spent.
These tiers tend to trigger customers’ desires to “rise to the challenge” of earning higher tiers and to belong to exclusive member groups. Both of these behaviors naturally lead to increased spending and higher AOVs.
An example of a brand that used LoyaltyLion to improve AOV with this approach is Pulse Boutique. By creating a tiered loyalty program and focusing on building long-term customer relationships, the brand saw a 39% increase in repeat purchases and a 19% increase in AOV.
Take your Shopify AOV up a few notches with a loyalty program by LoyaltyLion
At this point, you should have a solid understanding of how and why calculating average order value is a good idea for tracking your Shopify store’s performance.
You’ll also leave with a few tips for improving your AOV, including building a loyalty program. However, not all loyalty program software providers are the same. So, make sure you narrow down your provider choices based on features you need, scalability, ease of use, library of integrations, and cost.
LoyaltyLion was made exclusively for Shopify and takes full advantage of its capabilities.
If you’re ready to look at loyalty program software options, take a three-minute product tour of LoyaltyLion to discover a loyalty platform built for your success.


