
Picture this: you, an ecommerce store owner, are at the bar with a friend of yours who’s also an ecommerce store owner. After a few drinks, you start talking casually about how your businesses are doing. Their store is an apparel brand, and yours stocks pet supplies (or slot in any other niches).
“Yeah, I noticed my average order value has gone up recently, sitting at about $74”, you say to your friend, happy about this positive trend.
“That’s pretty low,” they say, “mine is at around $141!”
You start debating about what a good average order value (AOV) really is, but you’re ignoring one obvious difference between your stores—you’re in totally different industries. So how are either of you to know what ‘good’ really looks like for the other?
That’s where industry benchmarks come to the rescue—saving you and your friend from debating all evening.
In this guide, we’ll give you a brief overview of average order value (what it is, how to calculate it, and where to find it if you use Shopify) and benchmark average order values by industry. If you’re already familiar with AOV, skip to the meaty data.
What is average order value? (And why is it important?)
In simple terms, the average order value of your store is a metric that shows the average amount of money your customers spend per order.
As we’ve indicated in our little intro scenario, your AOV will depend on your store’s industry. Home furniture, for example, typically has a much higher AOV because pieces of furniture are (generally) expensive, long-term purchases. Pet supplies, like our example, have lower AOVs because these are usually inexpensive purchases (like treats, leashes, dog beds, etc.).
But why is AOV an important metric to know? Higher AOVs mean you’re generating more profit per transaction and can better cover costs and fees related to each transaction (seems obvious, right?).
However, it also lets you see your customers’ shopping behavior. Knowing how much they typically spend on their orders can give you insights to use for your pricing and marketing strategies.
How to work out your average order value
Thankfully, even manually calculating your average order value is pretty easy; the formula is as follows:
Total revenue in X period (e.g., 30 days) ÷ the number of orders in the same period
So, let’s say your ecommerce store had revenue of $5000 in the previous month, and that revenue consisted of 200 orders, that means your AOV was $25.
(5000 ÷ 200) = 25
Pretty simple, right? To make it even more simple, if you use Shopify as the host of your ecommerce store, the software calculates it all for you.
You can find your Shopify average order value using the Customer Reports function. With Shopify, you can filter your AOV report to exclude draft orders, which a Shopify Partner demonstrated in the community support section:
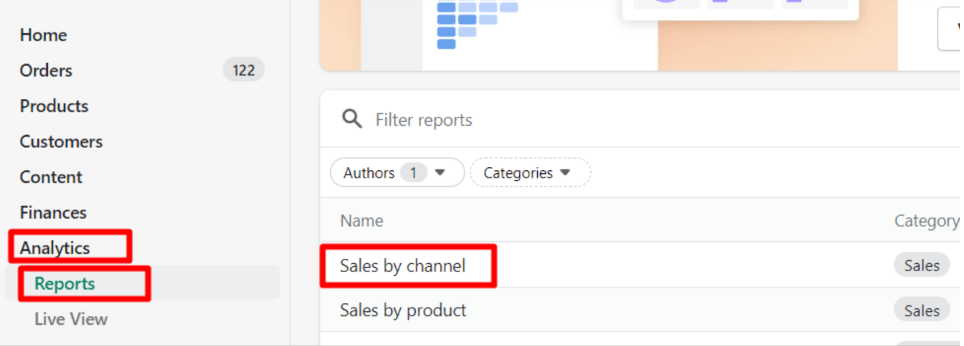
1.Go to your Shopify admin dashboard and click “Analytics” in the left-hand menu.
Click on “Reports” and then select “Sales by channel”
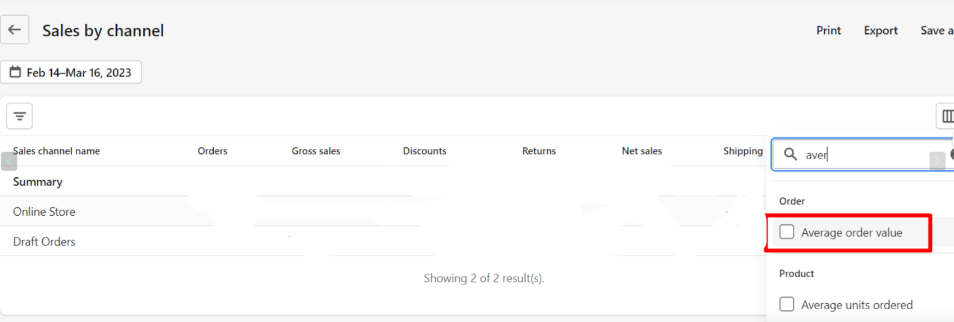
2. You’ll see a filter icon in the “Sales by channel” report in the top right-hand corner. Click on this filter icon.
3.In the filter options, you’ll see a checkbox for “Average order value”. Make sure this checkbox is checked.
Then:
Now you know exactly how to find or calculate your AOV, let’s look at some industry benchmarks to help you determine if you’re on the right track.
Average order value by industry: insights and benchmarks
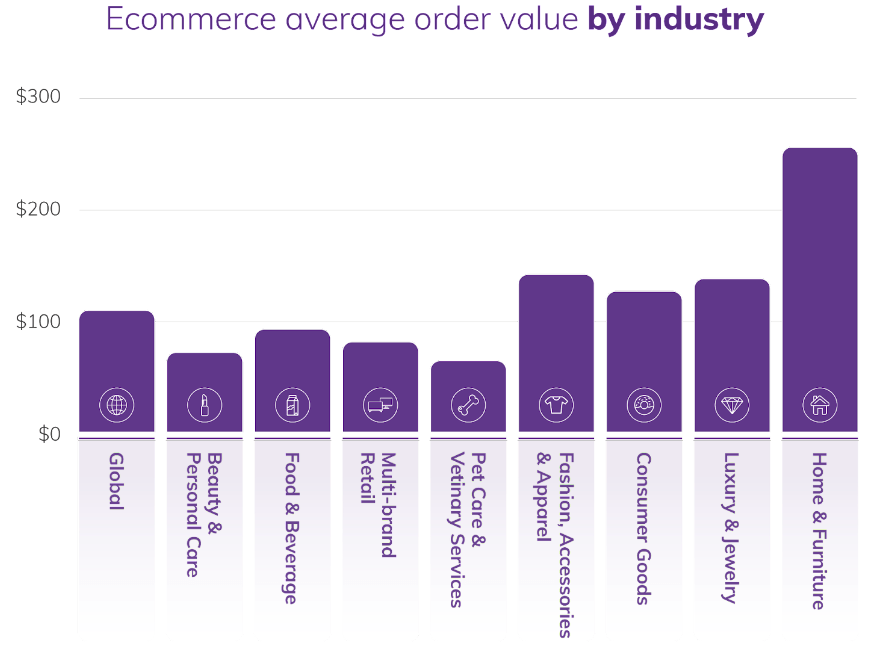
With a massive dataset of 200 million monthly unique users and 300 million total sessions, Dynamic Yield has potentially the best source of industry benchmark information available. As of June 2023, the stats look like this:
- Average order value globally is $109 over the last twelve months.
- Beauty and Personal Care is sitting at $72.
- Food and Beverage has an AOV of $93.
- Multi-brand Retail is back at a quarterly trend of $81.
- Pet Care and Veterinary Services is falling month-by-month at $65.
- Fashion, Accessories, and Apparel is seeing a slight dip in an otherwise increasing trend at $141.
- Consumer Goods have seen a lot of ups and downs over the past year but are currently sitting at $126.
- Luxury and Jewelry have also seen a dip compared to the previous month, currently at $137.
- Home and Furniture with the largest AOV (for previously stated reasons) is $254.
The data also shows that people are more comfortable making larger purchases from a desktop device than a mobile device—with AOV on desktop at $132, mobile at $109, and tablets at $86.
However, that’s not to say you should discount mobile optimization for your store, since people still like to buy on the go.
So how does your AOV compare to your relevant industry benchmark? Is it better than average? Or a bit lower? If it’s the latter, check out the next section.
Need to improve your AOV?
There are a couple of tactics you can use to bump up your AOV numbers, which are standard practice in the ecommerce industry, like:
- Cross-selling a different or complementary product to recent purchases (which you can do with post-purchase emails or “people also buy…” before the checkout page).
- Upselling by convincing a customer to buy a better (more expensive) version of a product or subscription.
- Volume discounts or bundles if your product is one that customers typically buy frequently.
However, there’s one strategy that has been proven to increase your average order value, and that’s a loyalty program. A study from Bain & Company found that the top 10% of a businesses’ customers order 3x more per order than the rest. The top 1% of customers order 5x more than the rest. And after 30 months of loyalty, customers spend 67% more than their first purchase.
In practice, using loyalty program software helps ecommerce stores increase their AOV by a significant margin.
For example, Neom Cosmetics implemented LoyaltyLion in their tech stack, encouraging customers to become program members (offering five Neom points for every £1 spent), and delivering personalized communications throughout the customer journey. They very quickly found themselves with much healthier numbers—including a 45% increase in AOV.
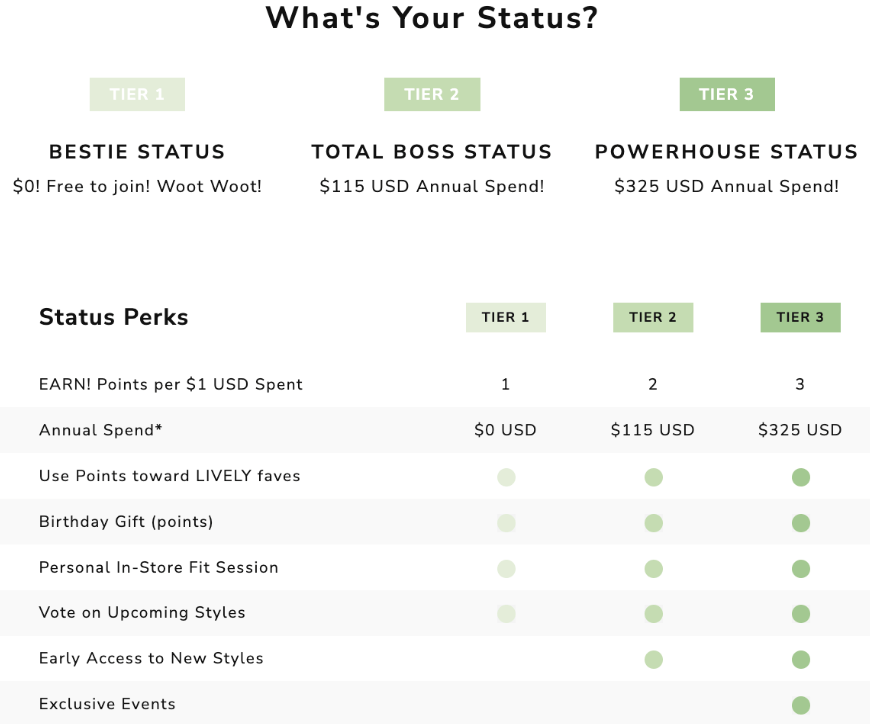
In a similar case study, implementing a loyalty program helped LIVELY increase their AOV by 21% (as well as a 36% increase in member spending, 37% more repeat purchases, and a 39% increase in customer lifetime value). To increase AOV, LIVELY awarded customers with extra points as they moved up their tiered loyalty program structure.
Adopting a loyalty strategy is a great long-term plan for growing your ecommerce business, and you can use these loyalty tips to increase your AOV too.
Increase your store’s AOV with LoyaltyLion
One of the best features of Shopify (other than the obvious core services) is its integration library—Shopify stores have a ton of integrations available to help them grow, including LoyaltyLion.
To learn how LoyaltyLion can help your ecommerce brand with its loyalty strategy, book a demo with us today.


